File:Am9017 surface plot.png
No higher resolution available.
Am9017_surface_plot.png (500 × 500 pixels, file size: 154 KB, MIME type: image/png)
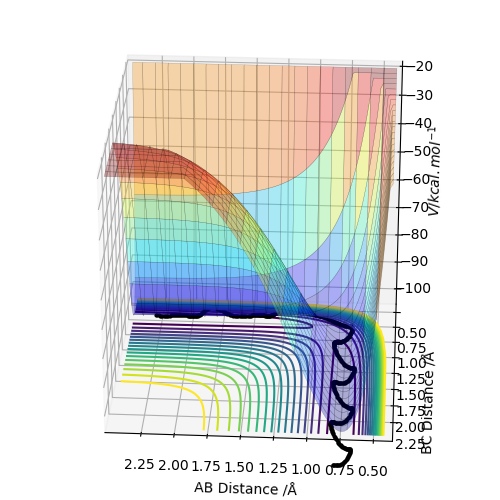
Surface plot of the reaction between A and BC. The black line at the bottom is the trajectory followed by the system. Red/Yellow mean high potential energy and blue means low potential energy.
File history
Click on a date/time to view the file as it appeared at that time.
| Date/Time | Thumbnail | Dimensions | User | Comment | |
|---|---|---|---|---|---|
| current | 17:26, 8 May 2019 | | 500 × 500 (154 KB) | Am9017 (talk | contribs) | Surface plot of the reaction between A and BC. The black line at the bottom is the trajectory followed by the system. Red/Yellow mean high potential energy and blue means low potential energy. |
You cannot overwrite this file.
File usage
There are no pages that use this file.
